Tržišno učešće srpskih proizvoda na tržištima glavnih spoljnotrgovinskih partnera je veoma nepovoljno poslednjih godina. Srpski izvoz čini svega 0,048% svetskog izvoza (2012), a čak je 2013. godine 92,8% izvoza završilo na evropskom konitnetu. Siromašan izvozni asortiman čini srpske proizvode konkurentnim samo na tržištima zamalja Balkana.
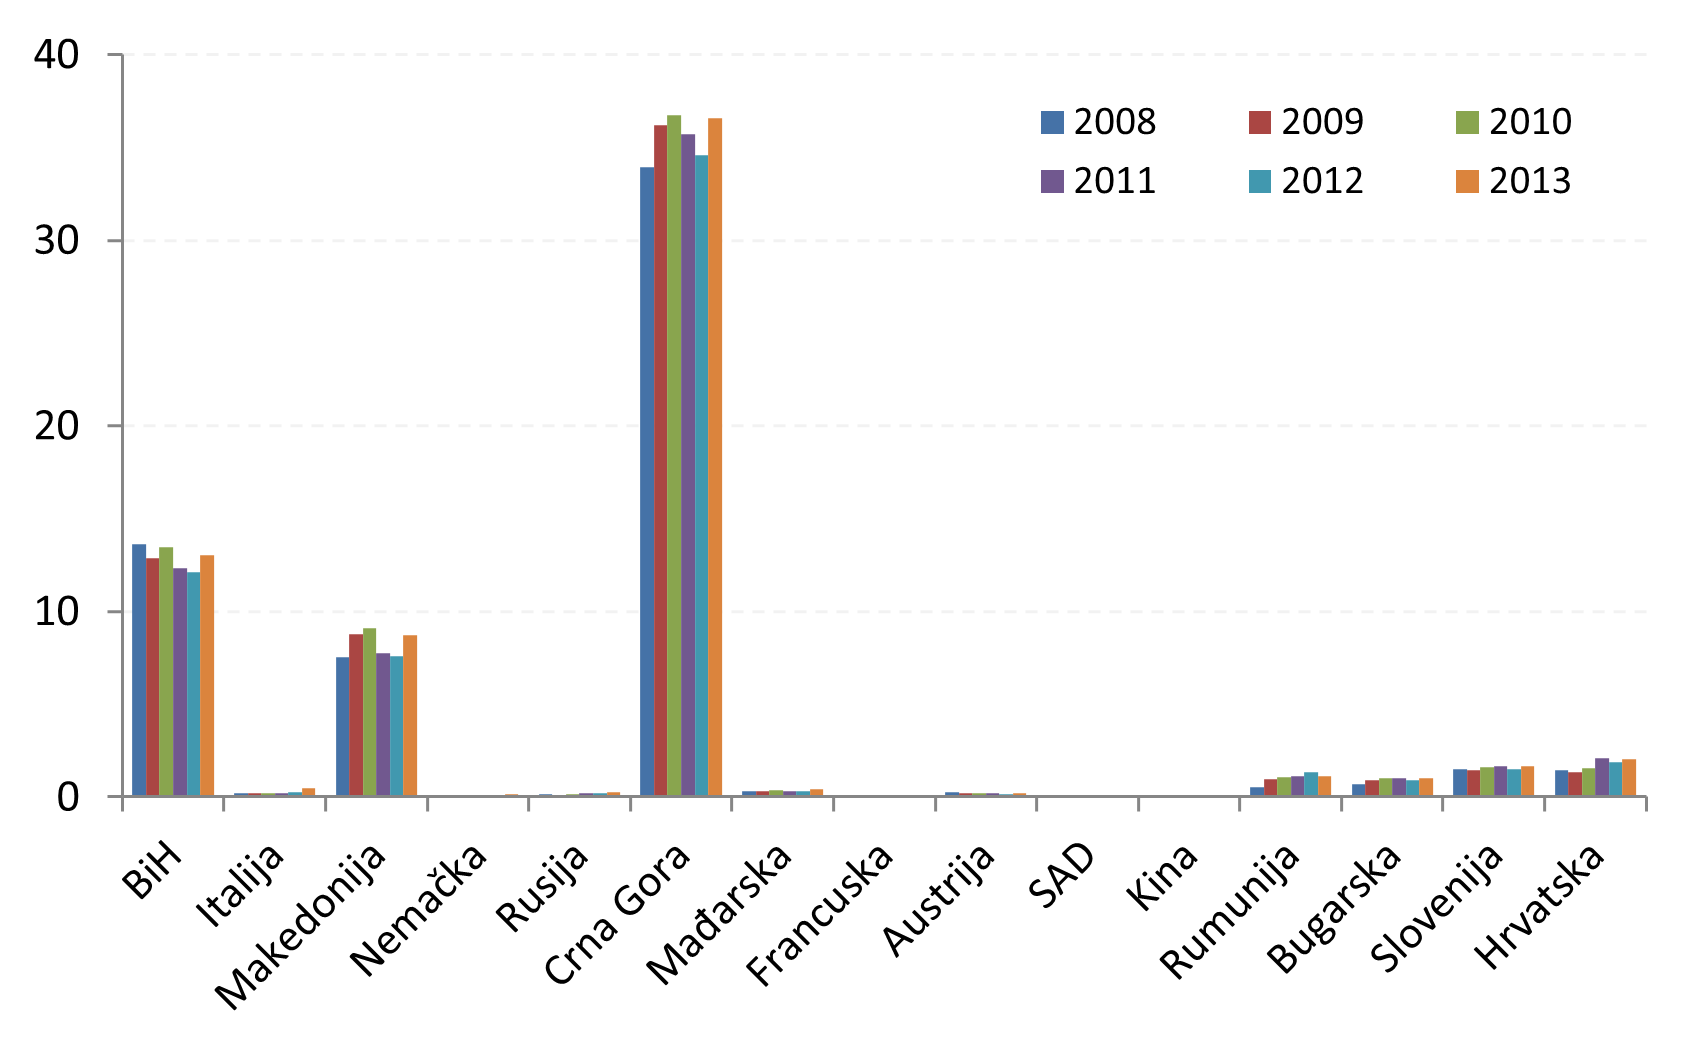
Srpski proizvodi pokazuju tradicionalno visoku konkurentnost u bivšim jugoslovenskim republikama Crnoj Gori, Bosni i Hercegovini i Makedoniji, u kojima je njihova zastupljenost najveća. Taj trend se poslednjih godina prenosi i na Hrvatsku i Sloveniju (beleže kontinuirano povećanje učešća krajem posmatranog perioda). Od razvijenih zemalja tržišno učešće Srbije je najveće u Italiji i Nemačkoj, dok se u ostalim zemljama članicama EU beleže blaga povećanja tržišnih učešća. Povećano je tržišno učešće i u zemljama iz okruženja, članicama EU, Rumuniji i Bugarskoj (otuda raste udeo izvoza srpske robe u zemlje EU sa 56% na 62,8% u posmatranom periodu).
Na blagi porast tržišnog učešća tokom posmatranog perioda u najvećoj meri je uticalo vrednosno malo prisustvo srpskog izvoza sa aspekta velikih zemalja spoljnotrgovinskih partnera, čija je apsorpciona moć velika, a samim tim konkurentnost i konkurencija snažnije izražena, te je otuda i manja procentualna zastupljenost tržišnog učešća Srbije. Nasuprot razvijenim tržitima, u manje razvijenim tržišnim privredama, čija je apsorpciona moć manja a pristup tržištu bez velikih ograničenja, vrednost srpskog izvoza je velika pa je i tržišno učešće veće. Međutim, pristup sofisticiranim tržištima treba da predstavlja izazov za srpski izvoz kako sa stanovišta kvaliteta proizvoda tako i sa stanovišta porasta produktivnosti, tj. konkurentnosti proizvoda i privrede.
Srpski izvoz čini svega 0,05% svetskog izvoza u 2013. godini. Agregatno tržišno učešće srpskih proizvoda kod 15 najvećih spoljnotrgovinskih partnera se pogoršava do 2013. godine (što je posledica sužavanja izvoznih tržišta ali ne i pogoršanja konkurentnosti proizvoda). Ujednačeniju sliku tržišnog učešća srpskih proizvoda imamo kod 12 glavnih spoljnotrgovinskih partnera (bez SAD i Kine – koje su više zastupljene na uvoznoj strani, i Crne Gore gde izvozni srpski proizvodi čine preko 30% ukupnog crnogorskog uvoza). Poboljšanje konkurentnosti u 2013. godini rezultat je smanjenog učešća ukupnog srpskog izvoza na evropskom kontinentu (sa 96,4% u 2008. godini na 92,8% u 2013. godini), ali i širenja izvoza na američko i azijsko tržište.
- Tržišno učešće je indikator izvozne konkurentnosti privrede. On pokazuje da li je rast ili pad izvoza rezultat poboljšanja/pogoršanja izvozne konkurentnosti privrede i/ili je to posledica povećanja/smanjenja izvoznog tržišta. Tržišno učešće jedne privrede izračunava se kao ponderisani prosek robnog izvoza privrede u uvozu njenih glavnih spoljnotrgovinskih partnera, određenih preko veličine njihovog učešća u izvozu te privrede. Pritom se učešća pojedinačnih spoljnotrgovinskih partnera u izvozu te privrede uzimaju kao ponderi za izračunavanje prosečnih pondera upotrebom Fišerove formule.
The market share of Serbian products in the markets of its main foreign trade partners has been very unfavorable in recent years. Serbian exports account for only 0.048% of global exports (2012), while as much as 92.8% of total exports in 2013 were directed to the European continent. A limited export assortment makes Serbian products competitive mainly in the markets of Balkan countries.
Serbian products traditionally demonstrate high competitiveness in the former Yugoslav republics – Montenegro, Bosnia and Herzegovina, and North Macedonia – where their market presence is the strongest. In recent years, this trend has also extended to Croatia and Slovenia, which recorded continuous increases in Serbia’s market share toward the end of the observed period. Among developed countries, Serbia’s market share is highest in Italy and Germany, while slight increases are also observed in other EU member states. Market share has also increased in neighboring EU countries, Romania and Bulgaria, contributing to the rise in the share of Serbian exports to the EU from 56% to 62.8% during the observed period.
The modest increase in market share during the observed period is largely attributable to the relatively low value of Serbian exports in large partner economies with high absorptive capacity, where competition is intense and Serbia’s percentage market share is consequently smaller. In contrast, in less developed market economies – characterized by lower absorptive capacity and fewer market access barriers – the value of Serbian exports is relatively high, resulting in a larger market share. However, access to sophisticated markets should represent a key challenge for Serbian exports, both in terms of product quality and productivity growth, that is, overall competitiveness of products and the economy.
Serbian exports accounted for only 0.05% of global exports in 2013. The aggregate market share of Serbian products among the 15 largest foreign trade partners deteriorated by 2013, primarily due to the narrowing of export markets rather than a decline in product competitiveness. A more balanced picture of Serbia’s market share emerges when considering 12 main foreign trade partners (excluding the United States and China – where Serbia is more prominent on the import side – and Montenegro, where Serbian products account for over 30% of total imports). The improvement in competitiveness in 2013 resulted from a reduced share of total Serbian exports directed to the European continent (from 96.4% in 2008 to 92.8% in 2013), as well as from the expansion of exports to the American and Asian markets.
- Market share is an indicator of export competitiveness. It shows whether export growth or decline is the result of improved or deteriorated export competitiveness and/or changes in the size of export markets. The market share of an economy is calculated as a weighted average of its merchandise exports in the imports of its main foreign trade partners, with weights determined by each partner’s share in the total exports of that economy. These weights are calculated using the Fisher index formula.